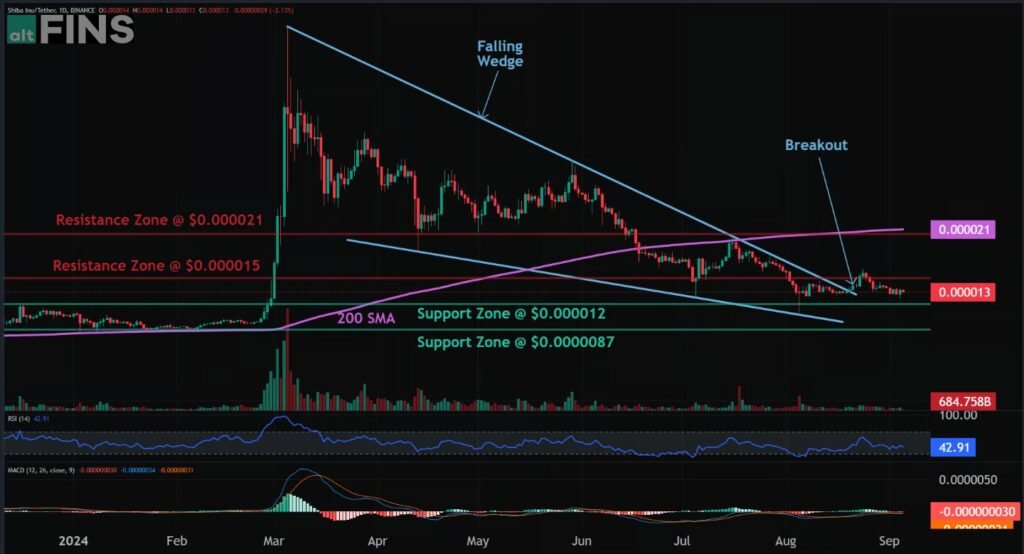
The Doge killer has been killing the gains of investors recently but now the crypto looks good for a buy on the charts.
Falling Wedge Usually results in a bullish breakout. When price breaks the upper trend line the price is expected to trend higher.
This is a riskier trade setup because the crypto is trying to go against overall trend.
For on-demand analysis of any cryptocurrency, join our Telegram channel.
Shiba Inu Price Analysis
- Current Price: $0.0000132
- Market Cap: $7,758,857,652
- 24h Trading Volume: $238,005,125
- 24h Price Change: -1.86%
- Circulating Supply: 589,260,946,684,517 SHIB

Price is in a Downtrend, however, it had a bullish breakout from Falling Wedge pattern, which could signal at least a temporary bullish trend reversal with +30% upside potential to $0.000020 resistance.
We wait for confirmation (price breaking above $0.000015 resistance). Stop Loss at $0.0000125.
Weekly Price Analysis
- 7-Day Price Change: -8.85%
- Week Open Price: $0.0000145
- Trend: Short-term trend is Strong Down, Medium-term trend is Strong Down and Long-term trend is Strong Down.
- Momentum: Price is neither overbought nor oversold currently .
- Support and Resistance: Nearest Support Zone is $0.000012, then $0.0000087. Nearest Resistance Zone is $0.000015, then $0.000021.
Key Indicators
- RSI: 42 (Neutral)
- MACD: Bearish (Signal line above MACD)
- Bollinger Bands: Price approaching lower band, indicating potential buying opportunity
All Time High
52-Week
Conclusion
Shiba Inu’s price is down slightly over the last week. Despite this, long-term indicators suggest the potential for future growth, especially with the upcoming development of the Shibarium ecosystem.
For on-demand analysis of any cryptocurrency, join our Telegram channel.


