The post Bitcoin’s Netflow Trends Suggest $100K Target May Be Delayed: Here’s What It Means appeared first on Coinpedia Fintech News
In the past few hours, Bitcoin has seen a notable rebound from its recent slump, triggered by FTX’s repayment of $1.2 billion to its creditors, which added substantial liquidity to the market. Despite this recovery, various on-chain indicators currently indicate that Bitcoin may not surpass the critical $100K mark in the coming days. This sentiment could present short-term holders (STHs) with a chance to establish a local peak in BTC’s price.
Bitcoin’s Netflow Continues to Rise
Bitcoin price faced a surge in buying demand as bulls successfully pushed the price above the $97K level. Data from Coinglass shows that Bitcoin price witnessed a total liquidation of around $22.24 million. Of this, sellers sold nearly $15 million worth of short positions.
The recent upward rally in the BTC price is driven by short term holders. Short-term holders (STH) have been key to Bitcoin’s latest upward swings. The amount of Bitcoin they hold suggests that the market is showing the accumulation phase observed in May 2021.
Also read: Bitcoin Price Prediction 2025, 2026 – 2030: Will BTC Price Hit $200,000?
However, they are holding out for the ideal moment to sell their holdings, which could lead to a sharp drop in the BTC price chart. This scenario could occur near the $100K mark, potentially further delaying the BTC recovery rally.
Data from IntoTheBlock indicates a rise in Bitcoin’s netflow. This metric has been climbing since February 16 and currently stands at approximately 1.82K BTC. This shows that inflow volume continues to surpass outflow volume.
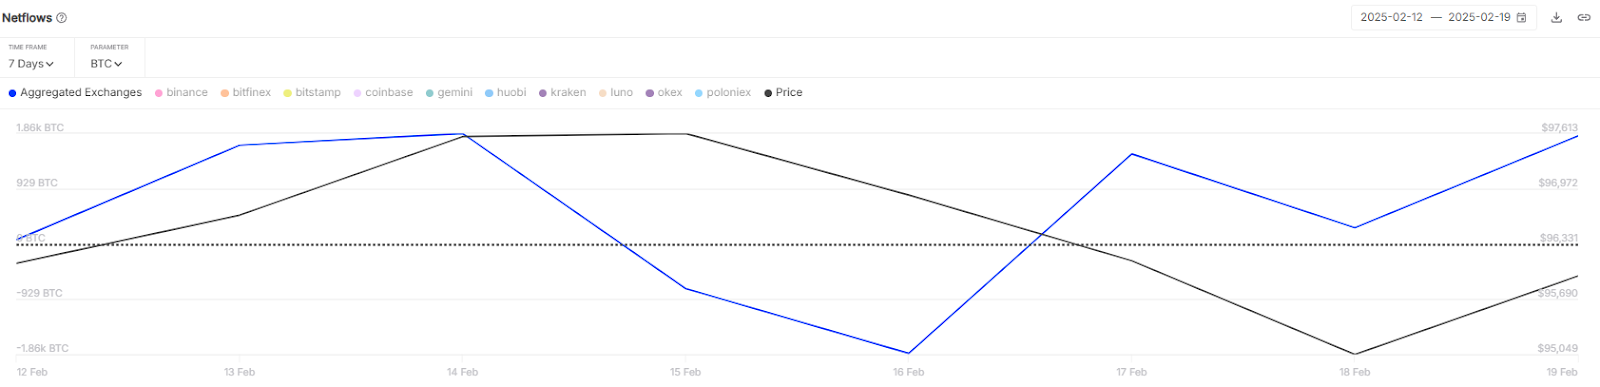
This means that investors are transferring their holdings to exchanges, thereby boosting the exchange reserve. As a result, this could create selling pressure that may delay Bitcoin’s ongoing recovery rally.
Currently, the funding rate is rising sharply as it stands at 0.006%. It suggests that buyers are now in control. Additionally, the long/short ratio is rising, currently at 1.1725, hinting at a rising bullish pressure. Right now, 54% traders expect the BTC price to correct upwards.
What’s Next for BTC Price?
Bitcoin’s price is surging as it faced increased buying confidence around the $95K dip. Currently, Bitcoin is gaining continued buying demand after surging above $97K. However, bears might soon emerge to put a halt to this recovery rally. Right now, Bitcoin is trading at $97,777, which is a 1.9% increase over the last 24 hours.

The BTC/USDT trading pair is now looking to rise above the important $100K mark as buyers take more control around each Fibonacci channel. If Bitcoin keeps up this momentum, we could see it reach up to $102K. As the RSI level now hovers within the buying region at level, buyers will strongly defend a pullback on the price chart.
However, if Bitcoin can’t keep up this pace, sellers might drive the price back down below $95K. At this level, Bitcoin might retest buyers’ patience and a failure will consolidate the price above $92K.